Grains

U.S. Tree Nuts Lead Export Growth

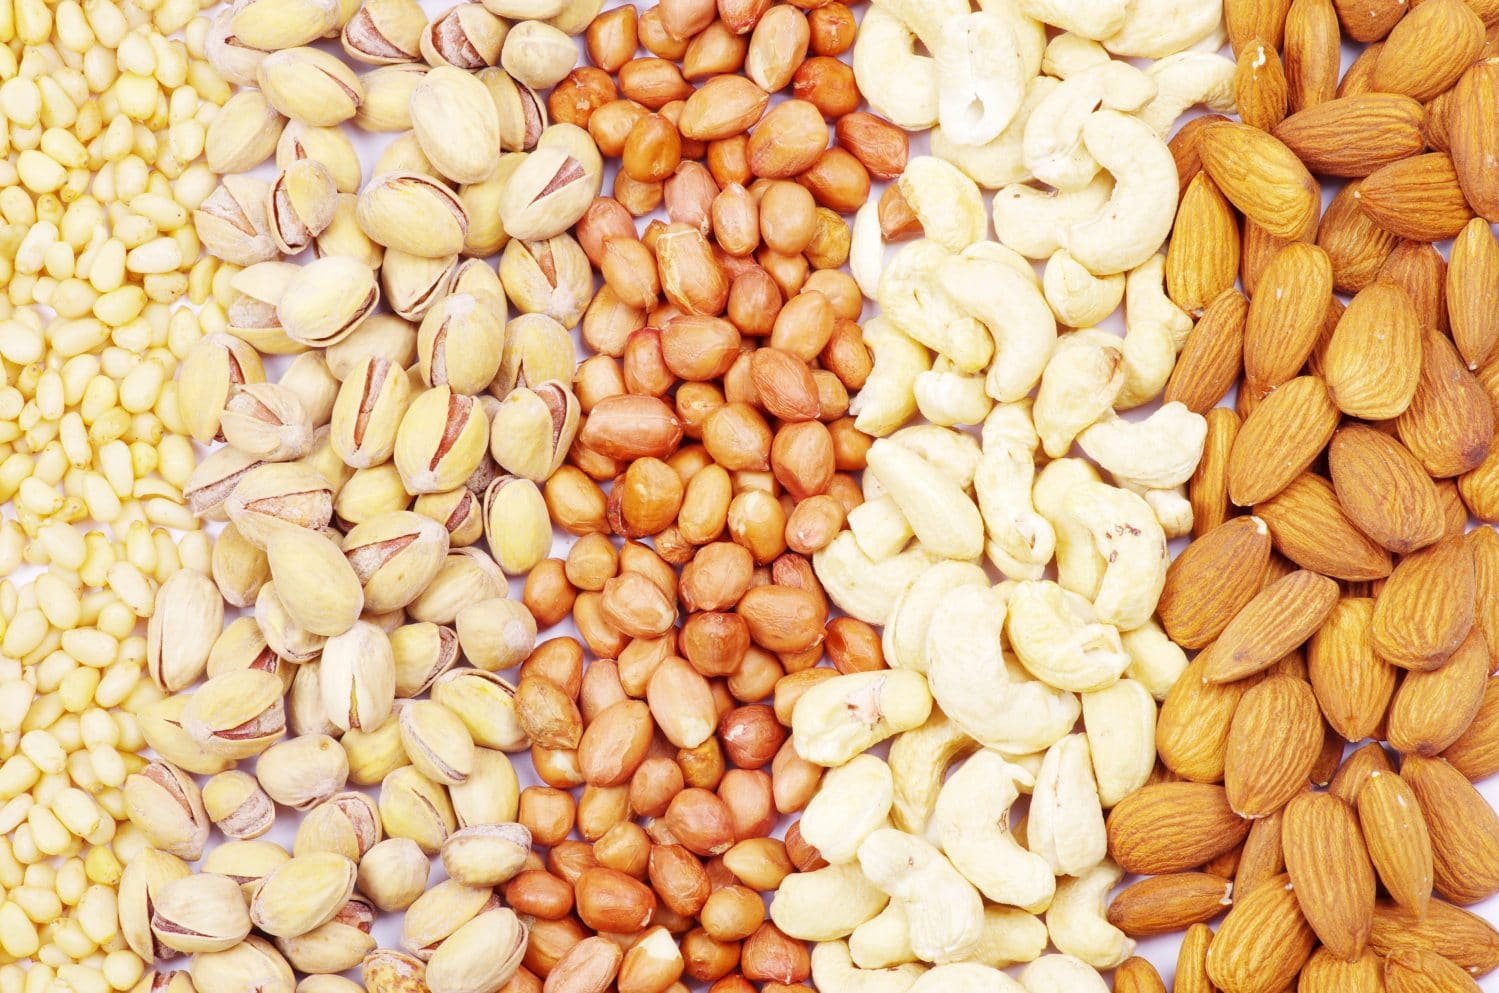
The growth rate for U.S. imports of agricultural goods has more than doubled the pace of U.S. ag exports since 1995, a new report on agricultural trade reveals. Rising incomes in developing countries will create more export demand for U,S, meat, dairy, fruits and nuts, according to the U.S. Department of Agriculture's Economic Research Service report, "The Global Landscape of Agricultural Trade, 1995-2014." Reflecting a growing middle class, developing economies accounted for 42% of all global agricultural imports in 2010-14, up from 28% in 1995-99. Global agricultural trade, at about $1 trillion in 2014, has risen 3.5% per year for the last two decades, the report said. World trade in farm products has been boosted by technological change, productivity gains, and trade liberalization, according to the report. Import hot streak U.S. consumer demand for imported fruits and vegetables in the off-season is one reason why U.S. imports of consumer-oriented products have grown faster than total agricultural imports, according to the report. At $110.6 billion in 2012-14, the U.S. was the world's third-largest importer of agricultural products, behind the European Union ($133.9 billion) and China/Hong Kong ($132.1 billion). U.S. imports of fresh fruit, snack foods, and carbonated soft drinks grew especially quickly between 1995 and 2014, according to the report. The USDA said the fastest growing sources of consumer-oriented imports were Vietnam (cashews, pepper), China (fruit and vegetable preparations), Peru (fresh fruits, asparagus), Switzerland (carbonated soft drinks), and Mexico (fresh/processed vegetables and fruits, beer, snack foods, beef). U.S. import growth outpaced exports, rising at an average annual rate of 4.3% from a real value of $51 billion in 1995-99 to $96 billion in 2011-15, according to the report. By way of comparison, the real dollar value of all U.S. agricultural exports grew at an average annual rate of 1.4% over the last two decades, from an average of $85 billion during 1995-99 to $105 billion during 2011-15. Tree nuts lead exports The U.S. is neck-and-neck with the European Union as the world's biggest exporter of agricultural goods, with U.S. exports averaging $148.1 billion in 2012-14, compared with $149.1 billion for the EU for the same period. The report said U.S. tree nut exports, led by almonds primarily destined for the EU and Hong Kong, grew twice as fast as other U.S. consumer oriented exports. U.S. exports of fresh fruits and vegetables grew more slowly than pork and dairy exports, according to the report.
Read more...

Trying To Beat Buzzer, Ag Groups Sign Letter In Hopes of TPP Rejoin

Three days after President Trump was inaugurated, one of his first exercises of presidential power was withdrawing the U.S. from the 12-nation Trans-Pacific Partnership (TPP). The remaining 11 nations are expected to sign the final trade agreement in March, and now U.S. farmers and ranchers are pushing for a last-minute rejoin. In a letter to U.S. Trade Representative Robert Lighthizer, the U.S. Food and Agriculture Dialogue for Trade urged him to re-engage in trade talks with other member-nations of TPP, which is driven by Japan, Australia, and Canada. "Once this happens, our sector will be placed at a substantial disadvantage as other countries gain entry into [agricultural] markets at substantially lower tariffs and under preferential terms," the letter read. Collin Woodall, senior vice president of government affairs with the National Cattlemen's Beef Association (NCBA), says some countries in the TPP would like to see the U.S. rejoin the agreement, but for now, it looks unpromising. "All of the people who are on board right now are doing everything they can to finish the negotiations on NAFTA and KORUS," he said. "There's not a lot of people sitting around looking at things to do. I don't believe getting back to TPP is something we're going to see in 2018." At the World Economic Forum in Davos, Switzerland last month, Trump made the suggestion of re-entering TPP "if it is in the interests of all." Legislatures from Australia, Brunei, Canada, Chile, Japan, Malaysia, Mexico, New Zealand, Peru, Singapore and Vietnam still need to ratify the deal.
Read more...

China's Best Weapon in a Trade War With Trump May Backfire

As tensions escalate between the U.S. and China, one crop is emerging as the most powerful weapon in a potential trade war: the soybean. China is the biggest buyer of American soybeans, picking up about a third of the entire U.S. crop, which it uses largely to feed 400 million or so pigs. President Xi Jinping's administration is studying the impact of restricting soybean imports in retaliation for U.S. tariffs on washing machines and solar panels, people familiar with the situation told Bloomberg last week. Any China soybean curbs would directly hit farmers in Midwestern U.S. states that President Donald Trump needs to win re-election in 2020. Yet they would also pose a big risk for Xi: His nation is the world's largest pork producer and consumer, and higher costs for pig farmers could increase prices of meat for his nation's 1.3 billion citizens. Food prices have long been a politically sensitive issue for China's ruling Communist Party, which rose to power in 1949 in the wake of economic mismanagement that led to hyperinflation. A surge in the cost of everything from pork to electronics in the late 1980s also stoked dissatisfaction in the run-up to the Tiananmen Square protests. Worst-Case Scenario "Using soybeans to retaliate against the U.S. would be a worst-case scenario" for China, said Li Qiang, chief analyst with Shanghai JC Intelligence Co., a private grains consulting firm. "Pork is a staple meat for Chinese people." China's Commerce Ministry and Agriculture Ministry didn't immediately respond to faxed questions about the potential impact of restrictions on soybeans. On pig farms in rural Tianjin, some 200 kilometers (124 miles) from Beijing, concern is growing. Standing next to a sow delivering piglets, Shi Ruixin said his costs would increase sharply if China squeezed U.S. soybean imports. "Hog feed prices will rise as well as pork prices," the 68-year-old farmer said. The seasonality of the soybean trade is one reason that China can't easily replace U.S. supply, even though authorities in Beijing have sought to diversify. Last year, China's imports from Brazil rose 33 percent to about 51 million metric tons, while those from the U.S. fell 3.8 percent to 33 million tons. Sun Chao, the president of Tianjin Tianjiao Group -- the hog feed producer that supplies Shi -- said that U.S. soybeans meet Chinese demand from October to February, when the South American crop is still growing. "U.S. supplies can't be replaced," said Sun, who manages a cooperative with 150 farmers and 30,000 pigs. "We rely on each other." Extremely Concerned Chinese officials began looking into measures against soybeans in January as trade tensions with the Trump administration began to heat up. The Commerce Ministry held a meeting with some Chinese companies to get feedback, and no conclusions were reached, Bloomberg reported earlier this month. Any final decision would be made by senior Chinese leaders. "We are extremely concerned by suggestions that U.S. exports, including soybeans, may face unjustified trade restrictions," Agriculture Secretary Sonny Perdue said in a statement. "American farmers are facing serious economic challenges without having to face bogus barriers erected strictly for political purposes. We are examining all tools available to us to assist our stakeholders." Painful for Everybody Trump has sought to close a trade gap in goods with China that surged 8.1 percent last year to a record $375 billion, according to Commerce Department data. Besides the duties on imported solar panels and washing machines, the administration last year began a probe into China's aluminum and steel sales and its intellectual property practices. China has responded by launching an anti-dumping and anti-subsidy investigation against U.S. shipments of the grain sorghum, a substitute for corn. Restricting soybeans would have an even bigger impact on American farmers. "It would definitely put downward pressure on prices," said Dave Salmonsen, senior director of congressional relations with the American Farm Bureau Federation, the biggest U.S. farmer group, based in Washington. "We're already in a surplus situation, and losing China would just make everything worse." Still, one U.S. farmer who hosted Xi during his 2012 visit to the U.S. doubts China will take action against soybeans. Grant Kimberley, who raises 4,000 acres of corn and soybeans northeast of Des Moines, Iowa, said Chinese soybean restrictions would lead to "dramatic swings" in prices that would disrupt trade throughout the world. "It would be painful for everybody," Kimberley said. "Painful for the Chinese, painful for the U.S. I don't see why anyone would want to do it."
Read more...

Divergence in Western Corn Belt Farmland Values

While some states in the Western Corn Belt are seeing strength in farmland values, others are showing weakness. That’s according to the most recent appraisal update conducted by Omaha-based Farm Credit Services of America and eastern Kansas’s Frontier Farm Credit. Iowa farmland values rose slightly in 2017, but the update notes values continue to decline in Kansas, Nebraska and South Dakota. The update found farmland values on the 21 Iowa benchmark farms appraised semi-annually by FCSAmerica rose 1.4% for the last half of 2017 and increased 1.8% for the year. Values on the seven eastern Kansas benchmark farms eased 0.1% the last half of 2017 and declined 3.2% for the year. Nebraska farmland values declined 2.8% on the state’s 18 benchmark farms for the last half of 2017 and all of 2017. Values on South Dakota’s 23 benchmark farms slipped 1.3% the last half of 2017 and decreased 3.1% for the year. Wyoming’s two benchmark farms and ranches rose 2.5% the last half of 2017 and increased 3.2% for the year. The average decrease for all 71 benchmark farms was -0.7%. Looking at farmland values on a five-year basis, the update notes Iowa farmland values are down 12.8%, Nebraska values are down 5.1%, South Dakota's values are up 15.6%, and Wyoming's values are up 38.5%. Looking at farmland values on a five-year basis, the update notes Iowa farmland values are down 12.8%, Nebraska values are down 5.1%, South Dakota’s values are up 15.6%, and Wyoming’s values are up 38.5%. Ups and Downs. Looking at farmland values on a five-year basis, the update notes Iowa farmland values are down 12.8%, Nebraska values are down 5.1%, South Dakota’s values are up 15.6%, and Wyoming’s values are up 38.5%. Looking at cropland values exclusively, the update notes cropland values are down 19.4% from their peak in 2013; Nebraska values are down 17.4% from their peak and South Dakota is off 9.2% from its peak. Divergence is evident between cropland values and ranch land and pasture values. Iowa cropland is up 1.8% on an annual basis, while pastureland is down a slight 0.4%. In eastern Kansas, cropland values are down 6.5%, while pastureland is up 1.2%. Nebraska’s cropland is down 2.4%, while pastureland is up 2.3%. In Wyoming, cropland is up 5.1%, and ranch land is up 1.4%. “Farmland prices were relatively steady across the associations compared to a year ago,” the lenders state. “The average quality of land sold also remained stable during this time and has not changed substantially over the past few years. Overall farmland sales activity declined compared to 2016. Public land auction activity for Iowa increased 2% from 2016 while activity in the other FCSAmerica/Frontier Farm Credit territory decreased an average of 22% from a year ago.” State-by-State. The six-month benchmark farm trends indicate: •Iowa: Of the 21 benchmark farms, 11 farms increased in value over the past six months, while 10 farms showed no change in value. •Kansas: Two of the seven farms showed no change, one showed an increase in value, and four farms showed a reduction in value. During the past year, benchmark values declined by 3.2% largely due to a significant 21% reduction in the sole irrigated cropland value. •Nebraska: Five of the 18 farms increased in value while two showed no change in value. The 11 farms that decreased in value declined an average of 6.1%. •South Dakota: Fourteen of the 23 benchmark farm values experienced no change over the past six months. Three farms increased in value and six farms decreased in value. •Wyoming: The one crop benchmark farm experienced a 5.1% increase, while the pasture unit experienced no change in value over the past six months. Sales have been and continue to be very limited in this market area.
Read more...

Deadly Bird Flu Strain Confirmed in 2 Missouri Poultry Facilities

A strain of bird flu that's deadly to poultry but poses no immediate public health concern has been detected in Missouri, state agriculture officials announced Sunday. The Missouri Department of Agriculture said in a news release that the virus was confirmed in turkeys at a grower facility in Asbury in the southwest part of the state. Preliminary tests also came back positive for the virus at a commercial turkey facility in Fortuna in the central part of the state. Sarah Alsager, a spokeswoman for the department, said in an email that it's the same highly pathogenic H5N2 strain of avian influenza that's been confirmed in Washington, Oregon, Idaho and Minnesota. The virus is carried by wild waterfowl that aren't sickened by it. The incubation period is about 21 days. In an effort to "contain and eliminate the disease," the unidentified Missouri facilities that were affected have been quarantined, the release said, adding that the remaining turkeys in the "involved flocks" will be killed and won't enter the food system. It was not immediately clear how many birds were infected. Officials also are performing surveillance and conducting testing at properties near the affected facilities to ensure the virus has not spread. The release said the Missouri Department of Health and Senior Services will monitor workers who may have been exposed to the virus but describes the step as a precaution. The agency said the U.S. Department of Agriculture is sending a team to Missouri to assist with the response.
Read more...

The Corn Strategy: Something Will Happen

This winter, farmers will undoubtedly be confronted with the infamous supply curve for commodities. Economists can’t explain what’s for lunch without drawing X-Y axes with price rising upward and quantity growing to the right. On this academic playing field, the consequences of market choices are gamed out. The supply curve is deceptively intuitive. The higher the price of something, the more of it producers will make. Most of us could get the basic plot correct. It is often simplified as a straight line, and the general orientation is southwest to northeast. Going upward (rightward) on the curve is commonsense. Prices go up, plant more acres, use more inputs. The reverse case is not always a mirror image. For example, once you plow up the pasture to plant corn, you’ve burned a bridge. Relatively straight-forward rotation changes between corn and soy can complicate the soybean supply curve, which can have its own surplus issues. Economic Complexities. For many Midwest farmers, the corn-soy two-step is more like a lockstep, with little room to adjust to lower prices, especially under dual oversupply conditions. Even in areas like the Northern Plains, with seemingly a wide range of planting options, corn acres can overwhelm those markets should farmers pursue other crops. For our farm, shifting from a 50-50 rotation would need to offer huge gains to offset agronomic costs. Above all, not planting anything is out of the question. What emerges is a plant-and-hope strategy. This is an understandable, if dubious, plan. Looking at modern production and price history, it seems when prices have plunged, something has always happened to slow production and push prices upward. Eventually. This might be a figment of hindsight. One problem is timing. For example, the last drought with sharply lower production occurred in 2012—not during an oversupply situation when it would have helpfully reduced stocks, but as demand from ethanol was ramping up. Weather doesn’t monitor the stocks-to-use ratio. The other obvious problem with this belief is how long it takes “something” to happen versus how long producers can lose money. There is a second outside force that can lower production: government intervention. Set-asides, grain reserves and other programs often take the decision to produce or sell out of farmer hands. The political will to implement such measures arises only after nearly universal producer economic hardship, extending throughout the production web to suppliers and lenders. We’re not there yet, I don’t think. Finally, low prices should stimulate usage, aka the demand curve. While this is hope-based as well, it does have economic justification. It is also largely out of producer control, however. In short, the most potent and influential action producers can take to reduce supply—plant less—brings immediate and certain economic hardship. Plant-and-hope at least postpones that reckoning even while raising the cost. Rising Surpluses. The something-will-happen strategy has worked long enough for memories of persistent surpluses and unprofitability to have faded. It will take severe hardship for most corn farmers to abandon that faith. This stubbornness will be reflected in the shape of the supply curve. The probability of continued overproduction is inversely proportional to the chances of a something-will-happen solution. It is not hysterical to contemplate a more likely scenario: even larger surpluses. The fact we seldom talk about this outcome reflects our sense of futility. Economics is an abstraction of our decision-making process. Little wonder reality often doesn’t match the graphics. Using any familiar form of the logical supply curve for corn this year might not help. For growing corn, we are locked into faith-based farming.
Read more...

Sorghum Acres Expected To Climb In 2018

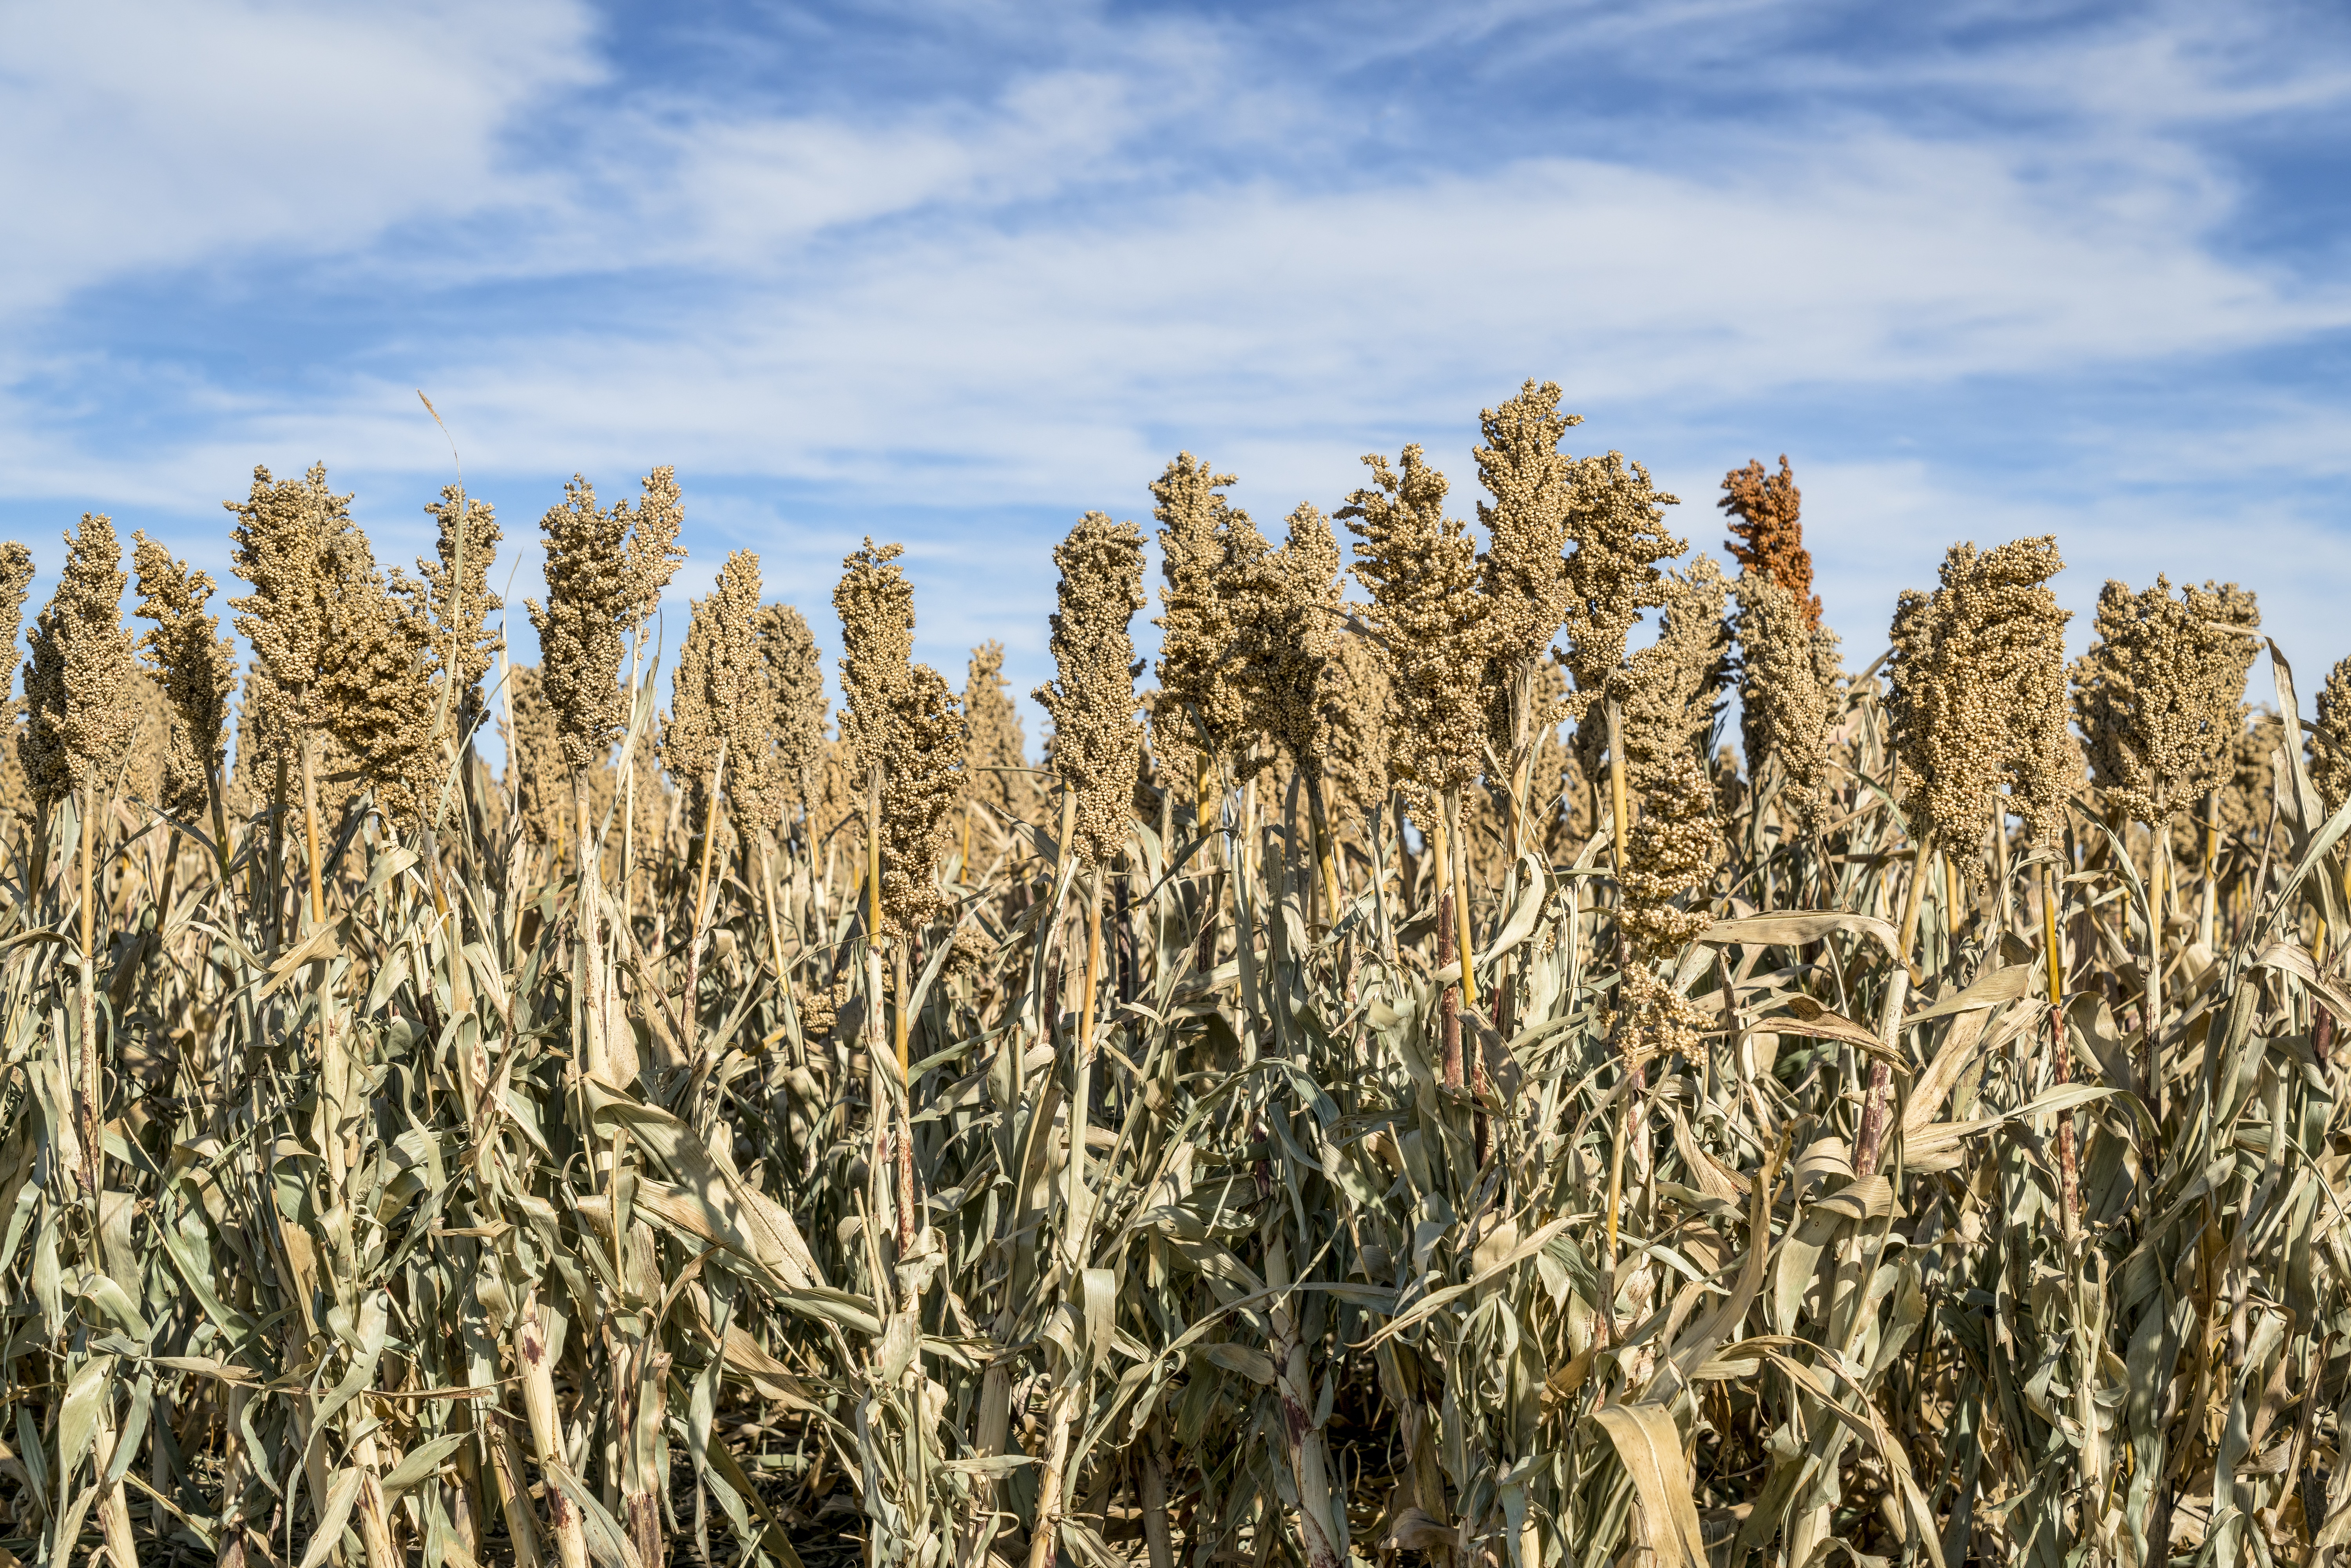
Sorghum demand and basis are strong, and many farmers are considering planting more of the crop in 2018. The United Sorghum Board (USB) expects a total of 6.7 million acres, an increase of 1 million acres—a 17% hike—from 2017 levels. “Sorghum recently hit the 1 billion bushel mark in exports to China,” says Brent Bean, USB agronomist. “The export market has remained strong for the past two to three years. We expect the mid-South and even mid-Atlantic states to grow more sorghum this year.” If you’re planting sorghum for the first time or for the first time in years, consider the agronomic advantages and disadvantages compared with corn and soybeans. “The biggest difference in production costs between corn and sorghum is seed,” says Kraig Roozeboom, Kansas State University agronomist. “Even when gross returns on sorghum might be less, input costs are dramatically reduced.” Sorghum costs from $7.50 to $14 per acre depending on seeding rate, while corn is typically around $100 per acre for seed. Depending on how early you plant sorghum, its ability to tiller (unlike corn or soybeans) could make up for lower seeding rates or poor emergence. “Sorghum needs 55°F to 60°F soil temperature, similar to soybean planting time,” Roozeboom says. “It will tiller more when planted early in cooler soils and less when planted later in warm soils. It can be planted as late as June depending on frost.” Sorghum provides additional advantages beyond input savings, according to Bean. These include: Tillering allows it to compensate for poor initial stands or skips and to provide for higher yield when weather conditions are good. It’s more drought tolerant than many other crops and responds well to water. Sorghum works great in rotation with other crops—cotton, soybean and corn yields have all been shown to be higher when following sorghum. Stalks make for excellent grazing for cattle or as residue for ground cover after harvest. Watch for weed and insect pests and don’t ignore plant nutrition. Sorghum is not Roundup Ready and has limitations on herbicide application. In addition, sugarcane aphid is an especially tricky pest with which corn and soybean farmers are unfamiliar. Select hybrids that display sugarcane aphid resistance and be sure to scout for the pest. Bean says farmers need to plan weed control in advance. “You have to use an effective pre-emergent with residual since post options are far fewer than corn and soybeans.” You’ll have options for hard-to-control broadleaves such as waterhemp and Palmer amaranth, he adds, but grasses could prove tricky because the herbicides that kill grasses kill sorghum. If you can protect fields from weeds until they reach canopy, you’ll be in good shape, which is one reason some experts recommend narrower rows. “If you can go with narrow rows, say 15" or use a drill, there is a lot of data that says you have the opportunity to capture more yield provided you have adequate rainfall,” Roozeboom explains. “Narrow rows tend to close the canopy sooner and potentially suppress weeds better than wider row spacing.” Take into account sorghum does have fertility needs. “We recommend 1.2 lb. per bushel for nitrogen, the same recommendation as corn,” Bean says. “The difference is in yield, where corn might yield 200 bu. per acre sorghum is probably more like 160 bu. per acre in the same field, so the overall need for nitrogen is less.” If you’re on new ground or unsure of your nutrient levels, take a soil test to make sure you’re not over- or under applying nutrients. Get the most out of sorghum by taking advantage of its strengths while compensating for weaknesses.
Read more...

More Delays for Bayer's Monsanto Acquisition

The European Union is continuing its probe into the possible combination of Bayer and Monsanto companies. Reuters reports EU antitrust investigators extended their investigation until March 12-five business days later than before. The more than $60 billion deal had been pushed back before and Bayer says it has provided more than four million pages of documents to investigators. "This was a known activity that could take place due to the size and scope of the proposed deal,” Bayer says in a statement provided to AgWeb. "Bayer and Monsanto will continue to cooperate with authorities to complete the transaction in early 2018.” The companies have received approvals from many countries and are making divestments as needed, including the LibertyLink platform to chemical competitor BASF. If Bayer and Monsanto do combine they say research in chemical, data science and seeds will be streamlined for simultaneous innovation.
Read more...

December Yields Record High Pork Production; Beef Up 4%

Additional packing capacity marked 2017 as a stand out year for hog producers. Large export and domestic demand also kept cattle supplies robustly current. Now, consumers are finally getting to take home the bacon and steaks, respectively. Pork production hit a record high in December, according to USDA-National Agricultural Statistics Service (NASS) Livestock Slaughter report, released Jan. 25. Pork production in December totaled 2.23 billion pounds, up 1% from December 2016. Hog slaughter totaled 10.5 million head, down slightly from December 2016. The average live weight was up 3 lb. from the previous year, at 286 lb. In total for the year, pork slaughter was up 3% from 2016, to 121 million head. Accumulated Beef Production Ends Year 4% Higher Beef production in December, at 2.15 billion pounds, was 1% below the previous year. Cattle slaughter totaled 2.58 million head, down 1% from December 2016. The average live weight was down 2 lb. from the previous year, at 1,379 lb. Veal production totaled 6.6 million pounds, 4% below December a year ago. Calf slaughter totaled 46,400 head, down 5% from December 2016. The average live weight was up 5 lb. from last year, at 245 lb. Lamb Production Lower Lamb and mutton production, at 12.8 million pounds, was down 2% from December 2016. Sheep slaughter totaled 188,100 head, 5% below last year. The average live weight was 136 lb., up 3 lb. from December a year ago. U.S. Read Meat Production Up U.S. commercial red meat production totaled 4.40 billion pounds in December, up slightly from the 4.40 billion pounds produced in December 2016. January to December 2017 commercial red meat production was 52.0 billion pounds, up 3% from 2016. Accumulated beef production was up 4% from last year, veal was down 1%, pork was up 3% from last year, and lamb and mutton production was down 3%.
Read more...

Did Your Wheat Survive the Cold?

Frigid temperatures mean more than just bundling up. For many farmers, it could mean their wheat crop has taken a hit. While there’s been some respite between cold snaps, they still could have caused damage. “As far as hard red winter wheat, [damage] is a concern in the Plains,” said Kyle Tapley, senior agricultural meteorologist with Radiant Solutions. “We think about a quarter of the crop saw some damage or at least temperatures were cold enough to cause some damage across about a quarter for the Belt, mainly in Kansas but also across parts of eastern Colorado and far northwestern Oklahoma.” If temperatures stay below zero for days at a time, survivability drops, says Phil Needham, Farm Journal high-yield wheat expert. “Wait until wheat comes out of dormancy to check for survival, but if you’re getting impatient you can go out now with a hammer or a pick and excavate a handful of wheat with roots and soil,” Needham explains. “Put it in the house for a week or two and see if it greens back up.” Even if you try the inside test it might not be a true representation of your fields as various zones endure cold in different ways—make sure you scout to ground truth. Be extra mindful of the possibility of winterkill in the following conditions, Needham says: Little to no snow cover during the cold temperatures. Remember, taller residue often helps retain more snow cover. Some varieties perform better than others in cold weather as a result of breeding. Check the winter hardiness or lack thereof in your varieties. In late-planted fields, the plant won’t reach a sustainable level of growth before going dormant, which makes it more susceptible to the cold. Fields or areas with greater levels of surface residue are more exposed to the cold. Because seeds are often more shallow or caught in residue, roots don’t reach “safe” depths. Shallow-planted fields will have more kill because the cold can reach root crowns faster and easier. Dry fields have less insulation. If you didn’t apply phosphorus at planting, wheat is at greater risk of death as the nutrient helps improve root mass, plant health and hardiness. When the seed furrow didn’t completely close (because it was too dry or wet at planting), the exposed row will be more likely to be damaged, especially without snow cover. Winterkill likely won’t be uniform across fields, so it’s important to scout in several areas—especially where you know there could be differences in how the seeds were planted. “To make a good assessment of a field, take stand counts,” Needham says. “If there are many areas where the stand has been wiped out, decide if you want to tear up the field or not.” In some cases you can spot plant, such as 5 acres with no stand in a 100-acre field. However, if a considerable portion of your field drops below 100 plants per yard it might be beneficial to rip up the stand, especially if there are pockets throughout the field. Needham suggests using a drone, if you have one, to check for dead areas, which will appear brown. Areas with snowfall will be in better luck because the snow insulates the crop. Kansas and parts of Colorado and Oklahoma, which received little to no snowfall, need to be especially diligent when scouting after greenup. “From mid-December to mid-February, Kansas wheat is at its maximum tolerance for cold temperatures,” says Marsha Boswell, director of communications, Kansas Wheat Commission. “However, winter injury is affected by several things. Time will tell in the coming months.”
Read more...