Illinois Yield Potential Shines Despite Mother Nature’s Challenges
When it rained, it poured and earlier this season, Illinois farmers just couldn’t get away from wet weather. It resulted in later planting, replant and some not-so-great planting conditions across much of the state. Despite it all, the state’s yields are beating three-year-average estimates.
When it comes to corn, yields are expected to be 4.35% higher than the three-year average and soybeans 5.19% higher. Scouts did note that tar spot, a potentially devastating new disease, was in two of the counties sampled (Knox and Stark).
While scouts did get into areas with damage, they aren’t in the heart of it just yet.
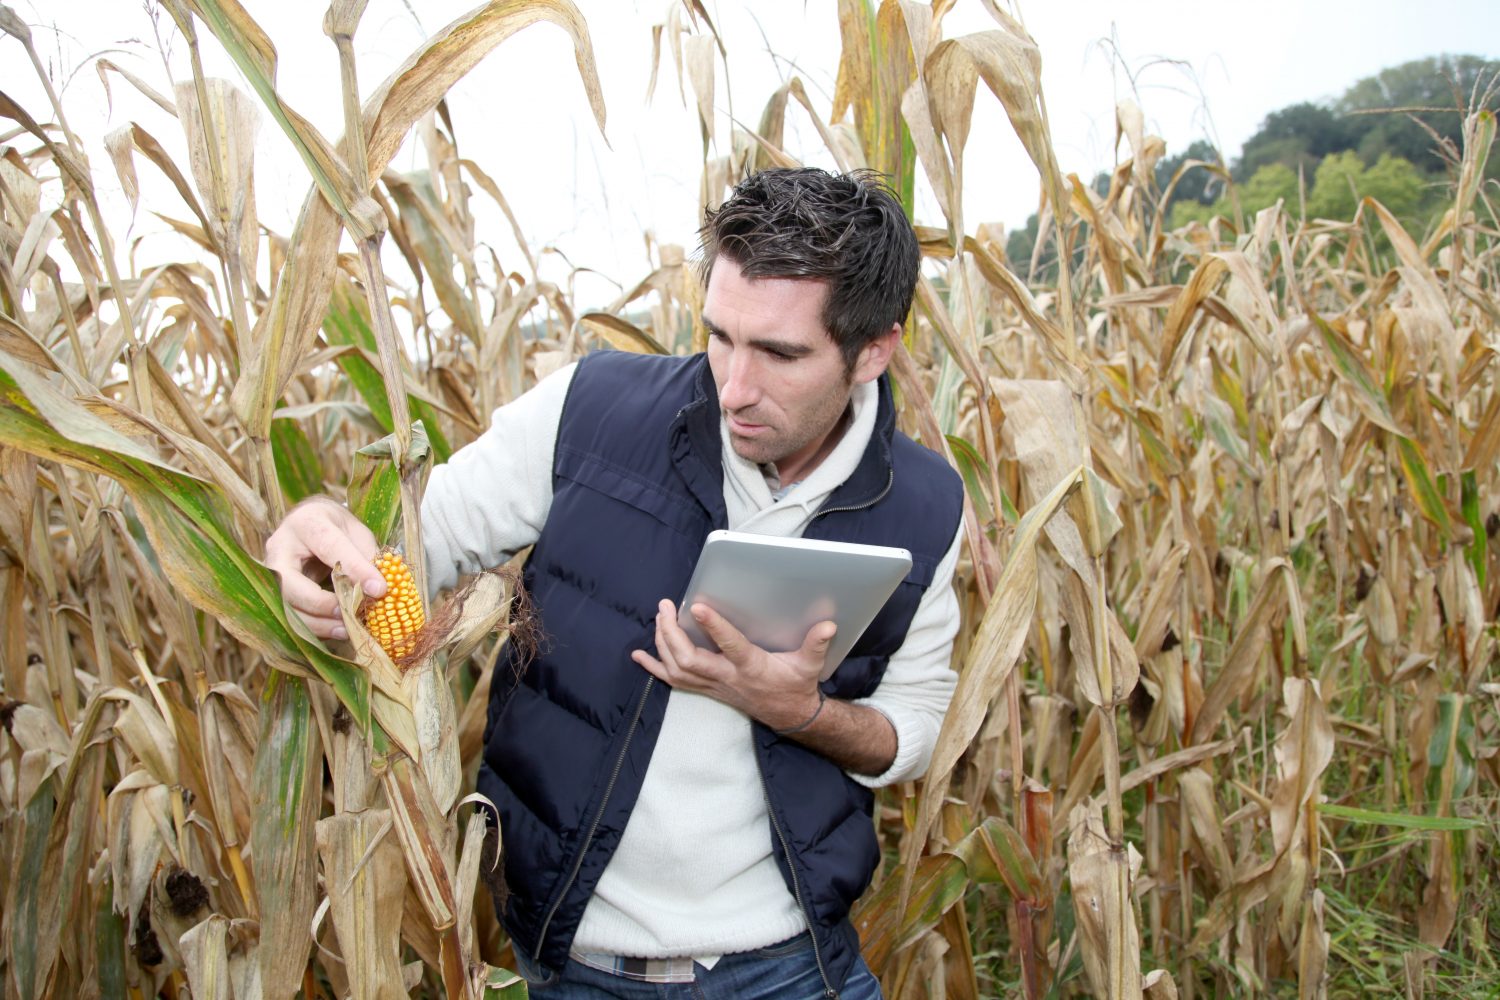
“We’ll get more intensively into it [derecho area] tomorrow,” says Brian Grete, Pro Farmer Editor. “It’s hard to scout through. It’ll take longer when it’s laying down in multiple directions. You have to ID the row, count the ears, it just takes time. You have to start from the ground up and it’s just time consuming.”
Illinois corn yield is expected to hit 189.40 bu. per acre, and soybeans are anticipated to reach 1247.38 pods per 3X3 square. The three-year average for corn is just 181.51 bu. per acre and soybeans per 3X3 square are 1185.79.
There were only three irrigated soybean fields and five irrigated corn fields sampled throughout the state. Doug Warters, scout on the eastern tour who made his way through Illinois and into Iowa today, said corn samples looked good but soybeans were more inconsistent along his route.
Damage from the recent derecho started showing up on the western side of Illinois. For some farmers, harvest could be extremely challenging—especially on corn acres.
“[For example] we had one field that we called ‘moderate’ lodging and wind damage where the corn was flat,” says Jim Smith, scout along the eastern leg of the Pro Farmer Crop Tour. “The yield estimate came out at 264 bu. per acre—but I’m sure we’re not going to get that 264 because the corn was so flat.”
It’ll be a low and slow harvest, and farmers with reels will be in a better position to gather as much of the yield potential as possible. Soybeans, however, were better looking because they were earlier in their lifecycles and had less lodging.
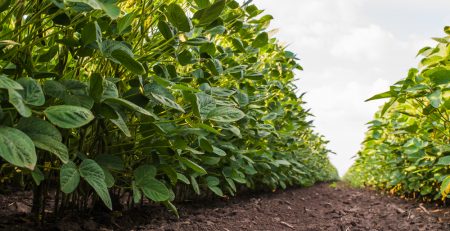
“All the fields we’ve sampled of soybeans have been extremely clean, no disease,” Smith says. “We still have a lot of questions on the beans though.”
On many of the plants he said they were counting pods, but it was still flowering and had only recently pollinated. With cooperation from Mother Nature, a substantial number of pods could develop between now and harvest, he adds.
As you’d expect, there was variation from crop district to crop district in terms of estimates. Check out each sampled district here (note corn is in bu. per acre and soybeans are in pods per 3X3 square):
- District 1
- Corn 183.63, 42 samples
- Soybeans 1321.97, 41 samples
- District 2
- Corn 201.19, 12 samples
- Soybeans 1220.00, 12 samples
- District 3
- Corn 195.63, 25 samples
- Soybean 1330.94, 25 samples
- District 4
- Corn 189.61, 55 samples
- Soybeans 1168.99, 55 samples
- District 5
- Corn 181.00, 53 samples
- Soybeans 1192.27, 52 samples
- District 6
- Corn 203.71, 12 samples
- Soybeans 1282.05, 12 samples
- District 7
- Corn 204.13, 14 samples
- Soybeans 1386.12, 14 samples
Scouts took 213 corn samples and 211 soybean samples this year. This exceeds the total number of samples, 399, scouts gathered in 2019.
First glance, Iowa burdened by drought and wind damage: As scouts snaked their way north and east from Nebraska and in from Illinois, the were inundated with clearly challenging conditions in the Hawkeye State.
“[I’d walk in and] there’s a good ear population and when I pulled my fifth, eight and eleventh ear there was one-half to two inches of tip back—that’s not a good sign,” says Jeff Wilson, Pro Farmer director for the western leg of the tour. The tip back issues and pollination issues he saw boiled down to drought issues in the southwest part of the state.
“The crop is mid-dent, so what you have is what you’re going to get,” he adds. “If you could get a little more rain maybe you could add test weight to make a higher quality crop.”
Soybeans stayed consistent along his route. Drier areas, of course, came in a little lower, but where the soybeans had moisture Wilson counted more than 1300 pods per 3X3 square on a nine-stop average. If the rains keep coming the soybeans should meet yield estimate expectations.
So far, scouts sampled three districts in the state. Here are the results so far (corn in bu. per acre, soybeans in pods per 3X3 square):
- District 1
- Corn 181.26, 81 samples
- Soybeans 1013.31, 81 samples
- District 4
- Corn 172.41, 72 samples
- Soybeans 1177.41, 71 samples
- District 7
- Corn 184.74, 55 samples
- Soybeans 1164.03, 51 samples
